DSM · velocities · mass balance
Glacier mapping: ice velocity and glacier change
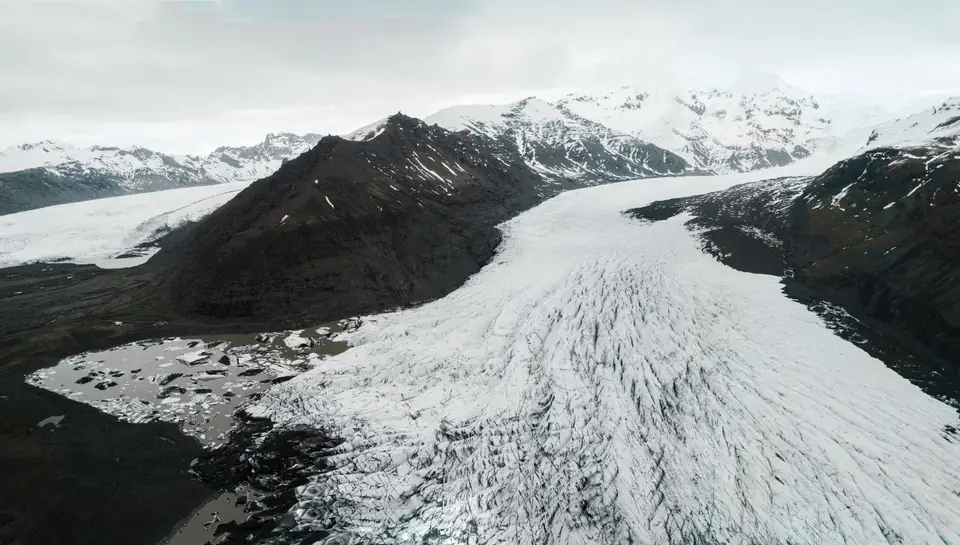
A glacier changes every year: it flows, thins and retreats. We survey the glacier with drone photogrammetry and LiDAR in successive campaigns and, by comparing the models of each date, calculate where and how fast the ice is moving, how much thickness it loses and where the terminus lies. Data with its uncertainty, for those who study or manage the glacier.
Why measure a glacier from the air
Glaciers respond to climate with changes in thickness, velocity and extent. Measuring them on foot is slow and risky: crevasses, seracs, steep slopes and a short field season. Stakes and GNSS profiles give very accurate data, but only at isolated points.
The drone covers the whole glacier at centimetre resolution. The area covered per day depends on the terrain, the sensor, the resolution required, the airspace and the planning; we set it in the flight plan for each campaign. Each campaign leaves a dated surface model and orthophoto, and comparing them with those of another date gives the change over the entire surface, not just at a few points. Satellite imagery covers whole regions, but with pixels of several metres; the drone reaches the detail that small glaciers, crevasses and termini require.
How we capture: multi-temporal photogrammetry and LiDAR
We fly the glacier and its surroundings with a metric RGB camera and, when the surface calls for it, with LiDAR. Photogrammetry gives the orthophoto and dense models where the ice has texture: crevasses, debris, moraines. LiDAR does not depend on texture, so it complements photogrammetry on fresh snow and very uniform surfaces.
Fixed ground control points cannot be placed on the ice, because they move with it. We place them on stable bedrock around the glacier and measure them with GNSS RTK; the drone also flies with RTK positioning. This keeps the models of every campaign in the same reference system, and the check is made on stable ground, which should not change between dates.
The accuracy of each model is expressed as root mean square error (RMSE) in the project reference system (ETRS89 / UTM, with orthometric heights unless another reference is requested). It is checked against independent checkpoints on stable bedrock that are not used in the adjustment. It depends on the sensor, the GSD, the ground control and the condition of the surface. The accuracy for each campaign is agreed in the proposal and documented in the control report.
Campaigns are planned for the end of the melt season, when the seasonal snow covers the least area, and repeated at the same time of year so that comparisons are consistent.
Ice flow direction and velocity by image correlation
To see how the ice moves we compare the orthophotos, or the hillshades of the model, from two dates using image correlation. The algorithm looks for each surface feature (a crevasse, a boulder, a patch of debris) in the later image and measures how far it has moved. The result is a field of displacement vectors over the whole glacier.
Dividing the displacement by the time elapsed gives the horizontal velocity, usually in metres per year, and its direction at each point. The vectors are filtered by correlation quality and by consistency with their neighbours, and the uncertainty is estimated from the apparent displacement on stable bedrock, which should be zero.
Geodetic mass balance, crevasses and terminus retreat
The difference between the elevation models of two dates, DSMs of the glacier surface, gives the elevation change in each cell: where the glacier is thinning and by how much. Integrated within the glacier outline, with both models in the same reference and on the same grid, it gives the volume change and, with an assumed density for ice and firn (commonly 850 kg/m³), the geodetic mass balance for the period. It is the same principle as an earthworks volume calculation, applied to ice.
On the orthophoto of each campaign we map crevasses, seracs, moraines and the glacier terminus. Comparing the terminus positions measures the retreat, in metres or in area lost, and documents its evolution year by year.
What we deliver and who it is for
For each campaign, the orthophoto, the digital surface model (DSM) and the point cloud. For each comparison between dates, the velocity map with displacement vectors, the elevation change map, the volume change and geodetic mass balance, and the mapping of crevasses and terminus positions. Everything in ETRS89 UTM, as GeoTIFF, LAS and SHP, with a report covering the method, the check on stable ground and the uncertainty of each result.
We work for research groups in glaciology and climate change, public bodies responsible for water and the environment, and the managers of national parks and protected areas. We organise campaigns across Spain from Xàtiva, with the flight authorisations and protected-area permits that apply.
Questions about Glacier mapping: ice velocity and glacier change
How is glacier velocity measured with a drone?
The glacier is flown on two dates and the orthophotos or models are compared using image correlation. The displacement of each surface feature divided by the time elapsed gives the velocity and direction of flow, usually in metres per year.
What is the geodetic mass balance?
It is the change in mass of a glacier calculated from the difference between the elevation models of two dates. The elevation change is integrated into a volume within the glacier outline and converted into mass with an assumed density. It complements glaciological measurements with stakes, which are point measurements.
How is the survey georeferenced if the ice moves?
With ground control points on stable bedrock outside the glacier, measured with GNSS RTK, and with the RTK positioning of the drone. The comparison between dates is validated on that stable ground, where the change should be zero: whatever is measured there is the uncertainty of the result.
LiDAR or photogrammetry on a glacier?
Photogrammetry when the ice has texture, such as crevasses or debris, because it also produces the orthophoto that image correlation needs. LiDAR when there is fresh snow or very uniform surfaces, where photogrammetry loses points. They are often combined.
How often should a glacier be flown?
For mass balance and terminus retreat, one campaign a year at the end of summer, always at the same time of year. To study velocity in more detail, flights can be repeated more often within the same season.
Tell us where the project is and what you need to solve
You can send us the site boundary, a plan or the specification. We will reply within one or two working days to review the scope and confirm when you can expect the proposal.