LAS · LAZ · E57 · classified
LiDAR and photogrammetric point clouds
The point cloud is the primary dataset of drone mapping. Each point has X, Y, Z coordinates and attributes such as intensity, colour or class. We capture it with LiDAR or photogrammetry, classify it and deliver it in LAS or LAZ, ready for deriving models or for working on it directly.
What is a point cloud
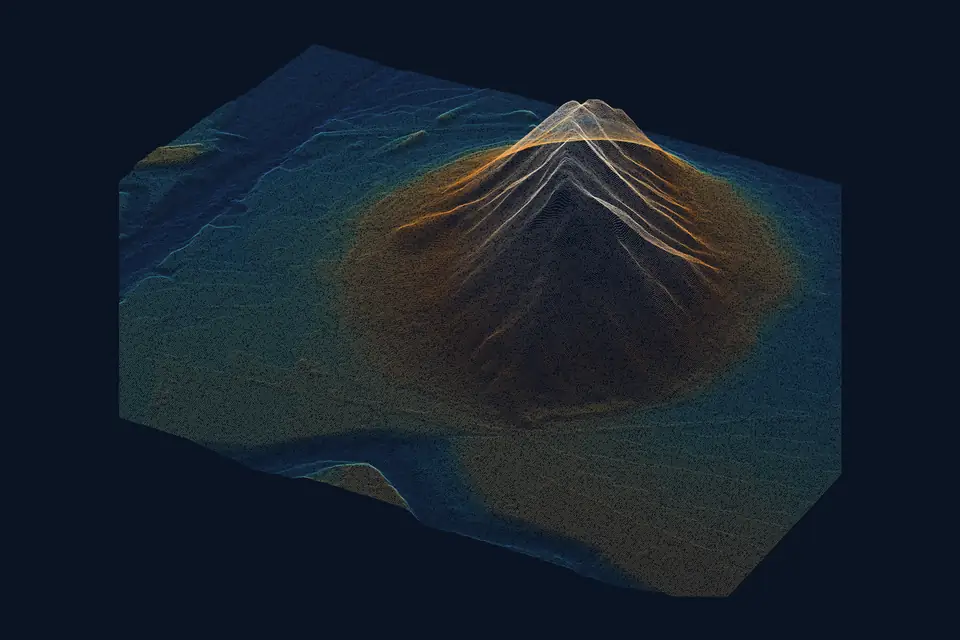
A point cloud is a set of millions of points with three-dimensional coordinates that describe the shape of a terrain, a building or an infrastructure asset. Each point can also carry its true colour, the intensity of the laser signal, the return number and a class (ground, vegetation, building).
It is not a continuous model: it is a dense sample of reality. The digital terrain model (DTM) and the digital surface model (DSM) are interpolated from it, contour lines are generated and 3D meshes are built. Measurements can also be taken directly on the cloud, with the advantage that there is no intermediate simplification.
LiDAR or photogrammetric point cloud
A LiDAR point cloud is generated by a laser sensor mounted on the drone. It measures distances directly and records several returns per pulse. Multiple returns help record the ground through gaps in the vegetation, and the laser captures cables, towers and thin structures. It is the option for power line corridors, wooded areas and ground covered in scrub.
A photogrammetric point cloud is computed from the photographs of the metric RGB camera, by matching between images. Every point has its true colour, and density is very high on well-textured surfaces. It is the option for construction sites, quarries, industrial estates and open ground. When the project requires it, we combine both in one cloud.
Point cloud classification
An unclassified cloud is just geometry. Classification assigns each point a class according to the ASPRS standard: ground, low, medium and high vegetation, building, water, power line conductors and towers, bridges or noise. It is done with automatic algorithms and checked manually in sensitive areas.
The DTM is interpolated from the points classified as ground. We check the coverage obtained, because under very dense vegetation ground points can be sparse. Heights and roofs come from the building class. Clearance analyses for high-voltage power lines come from the vegetation and conductor classes. Careful classification is what separates useful data from a heavy file.
Point density, accuracy and formats
Density is measured in points per square metre. Drone LiDAR works with densities of hundreds of points per m², compared with the few points per m² of PNOA-LiDAR, the national coverage flown by crewed aircraft under Spain's National Aerial Orthophoto Programme (PNOA). Photogrammetry, with a GSD of 2 to 5 cm/px (image resolution), reaches densities of the same order or higher on textured surfaces.
Typical accuracy is 2 to 5 cm, expressed as root mean square error (RMSE) on open ground or well-defined surfaces, in the project reference system (ETRS89 / UTM, with orthometric heights unless another reference is requested). It is checked against independent checkpoints that are not used in the adjustment. It depends on the sensor, the GSD, the ground control and the vegetation. The accuracy for each project is agreed in the proposal and documented in the control report.
We deliver the cloud in LAS or LAZ (compressed) with classification and colour, in E57 for engineering software and in PLY or XYZ on request. To view it without installing anything, we publish it on our web GIS platform with a 3D viewer.
What a point cloud is used for
The point cloud is the source of all the other products and a deliverable in its own right:
- Generating the DTM, the DSM, contour lines and project profiles.
- High-voltage power line inspection: vegetation clearance to conductors and actual catenary.
- 3D models of buildings, warehouses and structures for BIM and architecture.
- Volume measurement and comparison between dates on construction sites and in quarries.
- Asset inventory on industrial estates, roads and railways.
- Recording the existing condition of an infrastructure asset.
Questions about LiDAR and photogrammetric point clouds
What is a point cloud?
A set of millions of points with X, Y, Z coordinates describing the shape of a terrain or a structure. Each point can carry colour, intensity and class. It is the raw data from which terrain models are derived.
What is the difference between a LiDAR and a photogrammetric point cloud?
LiDAR measures distances with a laser, records the ground through gaps in the vegetation and captures cables and thin structures. A photogrammetric cloud is computed from photos and carries true colour. Depending on the site, one, the other or both combined are used.
What does point cloud classification mean?
Assigning each point a category: ground, vegetation, building, water, power conductor, noise. Without classification, the DTM cannot be extracted and clearances cannot be analysed. We deliver it classified.
What point density does a drone point cloud have?
Hundreds of points per square metre with drone LiDAR, far above the crewed PNOA flights. The exact density is set through flight height and speed to suit the project.
What format is the point cloud delivered in?
LAS or LAZ, the standard opened by QGIS, ArcGIS, Civil 3D, ReCap, CloudCompare and photogrammetry software. Also E57 or PLY if the client's software requires it, and in a web 3D viewer.
Tell us where the project is and what you need to solve
You can send us the site boundary, a plan or the specification. We will reply within one or two working days to review the scope and confirm when you can expect the proposal.