DWG · DXF · SHP · PDF
Contour lines
Contour lines are the classic way of showing relief on a plan. We generate them from a project-specific digital terrain model (DTM), produced with drone LiDAR or photogrammetry, at the contour interval the project requires. They are delivered for CAD and GIS, labelled and ready for design.
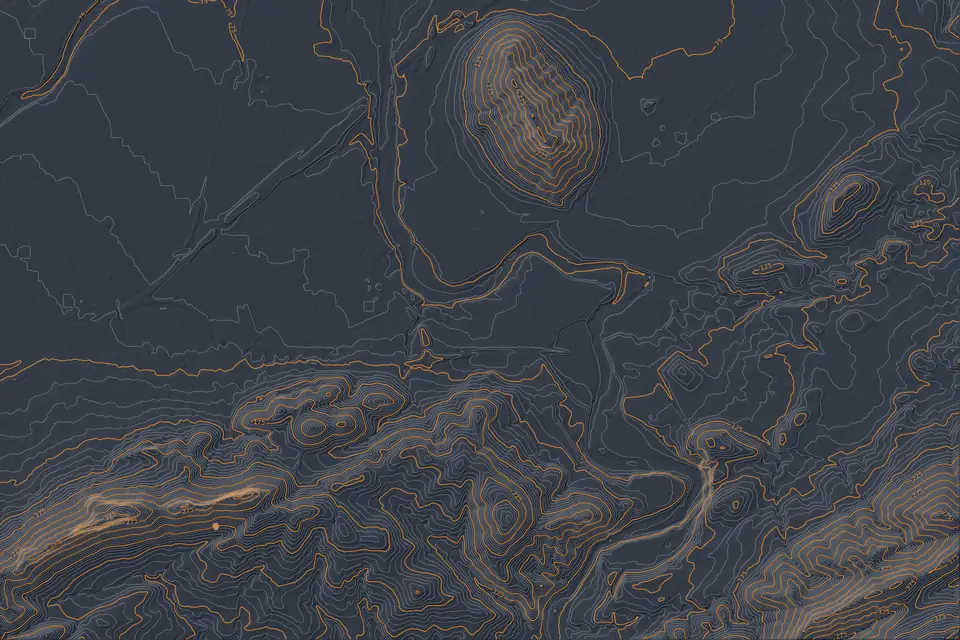
What are contour lines
A contour line joins all the points on the ground that have the same elevation. A contour map is a set of those lines drawn at regular height intervals. The closer together they are, the steeper the slope; the further apart, the flatter the ground.
They are the representation of relief understood by engineers, architects, public authorities and design software. A topographic plan without contour lines describes the ground poorly; with them, anyone can read valleys, ridges, embankments and platforms at a glance.
Contour interval: how often a contour is drawn
The contour interval is the difference in elevation between two consecutive contours. In official mapping at 1:25,000 it is usually 10 m. Building or urbanisation projects ask for contours every 0.5 m or 1 m, and very flat ground every 0.25 m or less.
Index contours, usually one in five, are drawn with a heavier line and carry the elevation label. Choosing the right interval depends on the slope of the ground and the scale of the plan: too small clutters the plan, too large hides the detail.
How contour lines are generated from a DTM
First, the DTM is produced with a drone: LiDAR if there is vegetation, photogrammetry if the ground is visible, with GNSS RTK control in both cases. The DTM is cleaned of buildings, vegetation and classification errors so that the contours follow the real ground.
The contours are then computed on that DTM at the required interval. They are smoothed just enough to be legible without losing accuracy, closed noise contours are removed, index contours are assigned and elevations are labelled. The result is reviewed over the orthophoto and checked against points measured in the field.
The same process can be reproduced in QGIS or Civil 3D from the DTM we deliver, in case the client wants to change the contour interval later.
Accuracy and formats of the contour plan
The contours inherit the accuracy of the DTM they come from. Their typical vertical accuracy is 2 to 5 cm, expressed as root mean square error (RMSE) on open ground, in the project reference system (ETRS89 / UTM, with orthometric heights unless another reference is requested). It is checked against independent checkpoints that are not used in the adjustment. It depends on the sensor, the GSD, the ground control and the vegetation. The accuracy for each project is agreed in the proposal and documented in the control report.
This makes 0.25 m contours meaningful on open ground, something impossible with a DTM on a 5 m grid.
We deliver the contours in DWG or DXF, with separate layers for index and intermediate contours and the elevation as an attribute or label; in SHP or GeoPackage for GIS; and as a scaled PDF with a title block when a printable plan is needed. Always in ETRS89 UTM.
Contour lines in surveying: what they are used for
Contour lines appear in almost any project that touches the ground:
- Topographic plans for building, urbanisation and industrial estate projects.
- Slope studies for siting solar PV plants.
- Design of road, track and canal alignments.
- Urban planning and documentation for local councils.
- Earthworks calculation and platform design.
- Drainage and runoff studies.
Official contour maps or a project-specific survey
Contour lines from official mapping (the IGN, National Geographic Institute of Spain, and the Institut Cartogràfic Valencià, the Valencia region's mapping agency) can be viewed and downloaded for free. They have contour intervals of several metres. They are useful for orientation and preliminary studies.
To design on a specific plot in Valencia, Alicante or Castellón, a project-specific survey is needed: contours every 0.5 m or less, showing the current state of the ground with centimetre accuracy. That is what projects require and what we deliver.
Questions about Contour lines
What are contour lines?
Lines joining points on the ground at the same height. Drawn at regular intervals, they show the relief on a plan: close together they indicate a steep slope, far apart, flat ground.
What is the contour interval?
The difference in elevation between two consecutive contours. In official mapping it is usually 10 m; building projects work with 0.5 m or 1 m, and flat ground with 0.25 m.
What contour interval does my project need?
It depends on the slope and the scale of the plan. For a building plot or a solar PV plant, 0.5 m or 1 m is typical. If in doubt, it is decided after seeing the ground and the intended use.
How are contour lines generated from a DTM?
Contours are computed on the cleaned DTM, smoothed, split into index and intermediate contours and labelled with their elevations. It can be done in QGIS, Civil 3D or photogrammetry software. The quality depends on the source DTM.
Are IGN contour lines good enough for design?
For preliminary studies, yes. For design, no: they have intervals of several metres, may come from flights several years old and do not show walls, terraces or recent changes. A drone survey solves all three.
What format are contour lines delivered in?
DWG or DXF for CAD, SHP or GeoPackage for GIS and PDF for printing. Each contour carries its elevation as an attribute, so design software recognises them as a surface.
Services that produce it and sectors that use it
Tell us where the project is and what you need to solve
You can send us the site boundary, a plan or the specification. We will reply within one or two working days to review the scope and confirm when you can expect the proposal.