GeoTIFF · SHP · PDF · CSV
Solar shading analysis for PV plants
A shading analysis determines which parts of a site are shaded by relief, vegetation or buildings, at each hour and in each season. We calculate it on the digital surface model (DSM) captured by drone, which records the terrain and every real obstacle. It is design data for any solar PV plant.
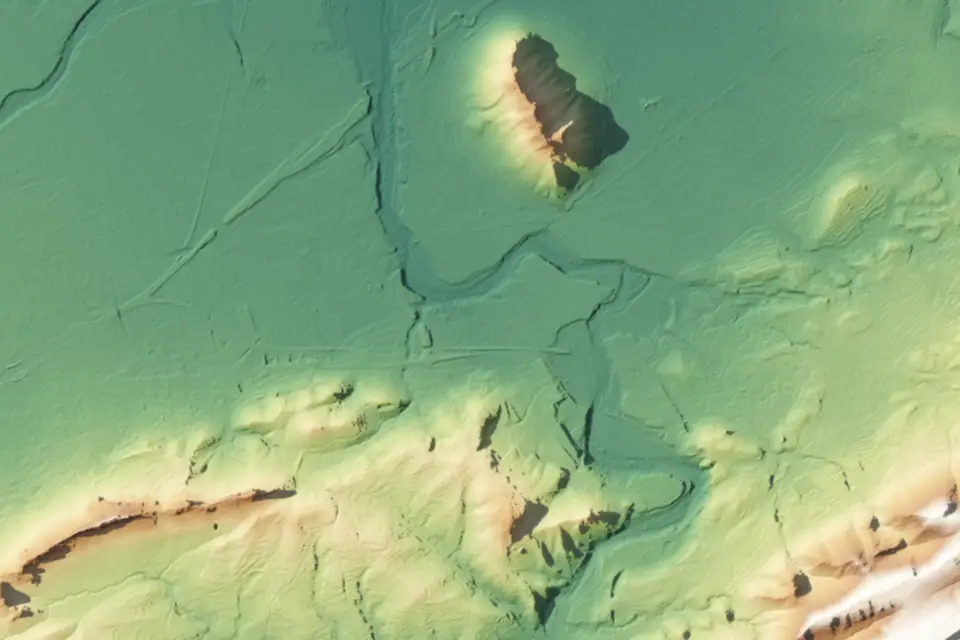
What is a shading analysis
A shading analysis calculates, for each point on the ground, how many hours of direct sun it receives and when it is in shadow. The position of the sun is simulated throughout the day and the year and projected onto the surface model: relief, hillsides, trees, warehouses, towers and any other obstacle.
In a solar PV plant, partial shading on a row of modules reduces the output of the whole string. Knowing the shading before design avoids placing modules where they underperform and allows row spacing and orientation to be adjusted.
How a shading analysis is done from the DSM
The starting point is the digital surface model (DSM) surveyed by drone, which includes the terrain and what stands on it. The local horizon of each cell is calculated on it: the elevation angle the sun must exceed to light the cell from each direction.
Using the solar path for the latitude of the site, a map of sun and shade hours is produced for representative days of the year (solstices, equinoxes or month by month). If the client provides the plant design, we also calculate the shading the module rows cast on each other with the planned height and pitch.
The drone DSM makes the difference: it has centimetre cells and records real trees, walls and buildings as they are on the flight date. An official 5 m model cannot tell a row of pines from an open field.
What you get: shading maps and shading losses
The main deliverable is a set of sun-hour maps by day and season, as georeferenced rasters. They come with the areas of significant shading delineated as vectors, horizon diagrams at agreed points and an estimate of shading losses for each sector of the plant.
If trackers or fixed structures have been defined, the study includes inter-row shading at low sun angles, the figure that sets the minimum spacing between rows.
Accuracy and formats
The accuracy of the study depends on the DSM. Its typical vertical accuracy is 2 to 5 cm, expressed as root mean square error (RMSE) on open ground or well-defined surfaces, in the project reference system (ETRS89 / UTM, with orthometric heights unless another reference is requested). It is checked against independent checkpoints that are not used in the adjustment. It depends on the sensor, the GSD, the ground control and the vegetation. The accuracy for each project is agreed in the proposal and documented in the control report.
On vegetation, the DSM records the height of the canopy at the time of the flight. The solar calculations use the astronomical position of the sun for the exact latitude and longitude of the site.
We deliver the sun-hour maps in GeoTIFF, the shaded areas in SHP or GeoPackage, the values per sector in CSV or XLSX and a PDF report with the method, the maps and the conclusions. The base DSM and orthophoto accompany the study.
What a shading analysis is used for
Beyond plant design, the shading analysis is used to:
- Define the layout: suitable areas, row spacing and orientation of the structures.
- Estimate shading losses for each sector for the energy yield study.
- Decide whether to clear scrub, prune trees or move the plant away from a hillside or woodland.
- Rooftop solar PV on industrial buildings: shadows from chimneys, parapets and neighbouring warehouses.
- Document shading in the permitting process.
- Compare layout alternatives on the same site.
Questions about Solar shading analysis for PV plants
What is a shading analysis for solar PV?
A calculation of which parts of a site receive direct sun and which are shaded by relief, vegetation or buildings, hour by hour and in each season. It is used to design the plant and estimate losses.
Why is it done from the DSM and not the DTM?
Because shadows are cast by obstacles: trees, warehouses, towers, walls. The DTM (terrain model) contains only the ground. The DSM records everything standing on it at the flight date, which is what matters for shading.
Does it include inter-row shading between modules?
Yes, if the client provides the planned height, tilt and pitch of the structures. With that data we calculate inter-row shading at low sun angles and the recommended minimum spacing.
What does the shading analysis deliverable include?
Sun-hour maps in GeoTIFF, shaded areas as vectors, estimated losses by sector in a spreadsheet and a PDF report. Always with the DSM and the orthophoto of the site.
Can it be done on industrial roofs?
Yes. A drone DSM of an industrial estate records warehouses, chimneys, parapets and rooftop equipment, and shows which part of each roof is shaded by its neighbours in each season.
Services that produce it and sectors that use it
Tell us where the project is and what you need to solve
You can send us the site boundary, a plan or the specification. We will reply within one or two working days to review the scope and confirm when you can expect the proposal.