Mapping ·
Contour lines: what they are and how they are made
Contour lines explained: what they are, how to choose the contour interval and how a drone DTM becomes a contour map ready for design work.
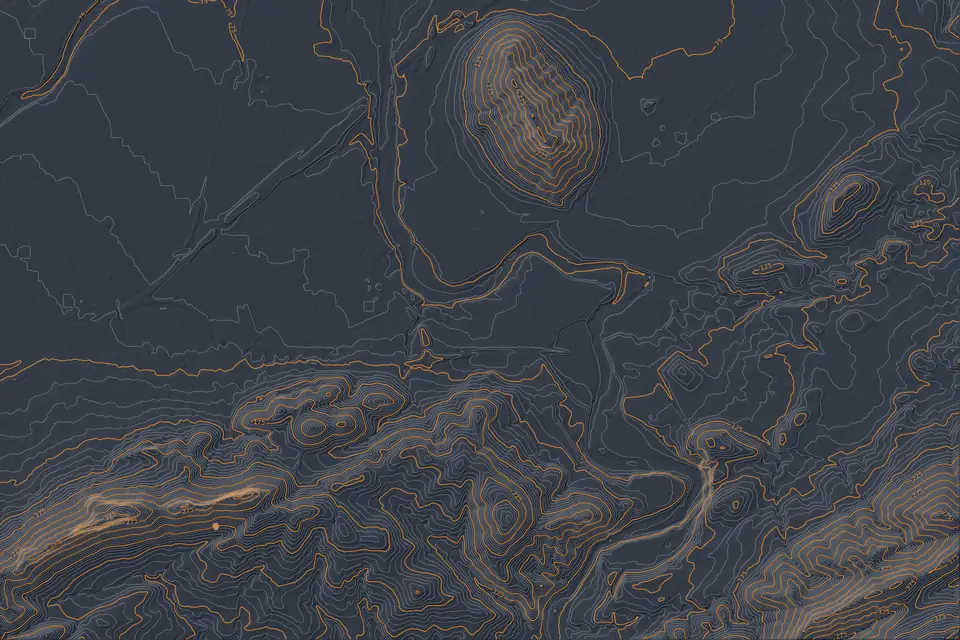
Contour lines are the classic way of showing relief on a plan: lines that join points of equal elevation. They let you see at a glance where the ground rises, falls or is flat. This article explains what contour lines are, how the contour interval is chosen and how they are generated from a digital terrain model (DTM) captured with a drone.
What are contour lines
A contour line is an imaginary line on the ground along which every point has the same height. If a hill were cut by a horizontal plane at 100 m, the line of the cut would be the 100 m contour.
Drawn together at regular intervals, they form a plan that reads directly:
- Lines close together: steep slope.
- Lines far apart: almost flat ground.
- Closed loops: a summit or a depression. The elevation of the neighbouring lines shows which one it is.
- V-shaped lines: valleys and watercourses. The point of the V faces upstream.
Contour lines do not cross each other, except on cliffs or overhangs, which are drawn with their own symbols.
Contour interval: the vertical distance between lines
The contour interval is the difference in elevation between two consecutive lines. It is the most important decision on a contour plan, because it sets how much of the relief can be seen.
- On official mapping at 1:25,000, the usual interval is 10 m.
- On building, urban development or site layout projects, lines every 0.5 m or every 1 m are requested.
- On very flat ground, where a slope is barely visible, the interval drops to 0.25 m or less.
The choice depends on two things: the slope of the ground and the scale of the plan. An interval that is too small clutters the plan and makes it unreadable. One that is too large hides the detail the project needs.
There is also a technical limit. The interval cannot be finer than the terrain model supports. If the DTM has a typical error of 2-5 cm (RMSE, on open ground and checked against independent checkpoints), contours every 0.25 m or 0.5 m make sense. Asking for lines every 5 cm from a model with that error only draws noise.
Index contours and intermediate contours
To keep the plan readable, not all lines are drawn the same way.
- Index contours, normally one in five, have a heavier line and a labelled elevation.
- Intermediate contours have a thin line and no label.
With a 1 m interval, for example, the index contours would fall every 5 m. That hierarchy makes it possible to find the height of any point without counting lines one by one.
How contour lines are generated from a DTM
Contour lines are not measured one by one on the ground. They are calculated from a digital terrain model. The drone workflow has these steps:
- Capture. A flight with LiDAR, a metric RGB camera or both, supported by GNSS RTK and ground control points measured in the field.
- Georeferenced point cloud, with millions of points.
- Ground classification. Terrain points are separated from vegetation, buildings and objects. Difficult areas, such as slopes and stream banks, are reviewed by hand.
- DTM. A surface is interpolated from the ground points only.
- Contour lines. An algorithm traces the lines for each elevation at the chosen interval from the DTM.
- Smoothing and editing. Raw contours come out jagged. They are smoothed without moving the line further than the accuracy of the model allows, and crossings, closures and areas with objects are corrected by hand.
- Quality control. The model is checked against independent checkpoints and documented in the control report.
This is why the quality of the contours is the quality of the DTM. A model with poorly classified ground produces contours that run through buildings or climb over trees.
LiDAR or photogrammetry for contours
- Photogrammetry only sees the surface. On open ground, such as platforms, low crops or quarries, it gives a very good DTM and reliable contours.
- Under dense vegetation, photogrammetry has no ground points to classify and the DTM is interpolated blind. The contours lose reliability there.
- LiDAR records several returns per pulse, which help to capture the ground through gaps in the vegetation. We classify the ground points and check the coverage obtained, which can be sparse under very dense vegetation.
Contour map: delivery formats
A useful contour map is one that opens without extra work in the project software. The usual formats are:
- DWG for CAD, with the lines on separate layers (index and intermediate) and labelled elevations.
- SHP or GeoPackage for GIS, with the elevation as an attribute of each line.
- PDF for a printed plan, at the agreed scale.
- GeoTIFF of the source DTM, in case the team wants to regenerate the lines at another interval.
The reference system is agreed at the start. The usual choice is official ETRS89 coordinates (UTM, in the appropriate zone), with orthometric heights unless the project asks for another reference.
What contour lines are used for
- Site layout projects. Solar, wind, warehouses or urban development: contours show slopes and help decide where each element goes.
- Earthworks. The design contours are drawn over the existing ones, and the difference between the two surfaces gives the volume to move (see volume calculations).
- Drainage. Valleys can be read directly from the contours, and the DTM then allows the drainage network and catchments to be calculated.
- Linear routes. Roads, tracks and power lines: together with longitudinal profiles and cross-sections, they define the alignment.
- Urban planning. A topographic base for planning a sector, at a scale the planning drawings can read.
Contours from public data and from a dedicated survey
Before commissioning a survey, it is worth looking at what already exists. The CNIG publishes the MDT05 for the whole of Spain (the National Geographic Institute’s terrain model) and, depending on coverage, finer products such as the MDT02 and PNOA-LiDAR point clouds. Contours can be drawn from them in any GIS program.
Those contours work for a preliminary study or for comparing alternatives. For a detailed design, three things need to be compared with what the project requires: the date of the data, its resolution and accuracy, and the level of terrain detail. Ground that has changed since the last pass, or a 0.5 m interval that a 5 m cell model cannot support, are the cases where a dedicated survey provides what is missing.
Frequently asked questions
What contour interval should I ask for?
It depends on the slope and the use. For building or site layout work on rolling ground, 0.5 m or 1 m are common. On very flat ground 0.25 m or less may be needed. If in doubt, state the use of the plan and the print scale, and an interval is proposed with the accuracy of the model in view.
Can contour lines be generated from a DTM I already have?
Yes, in any GIS or CAD program. What cannot be done is to ask the model for more detail than it has: the interval is limited by its resolution and accuracy. If the DTM is old or has a large cell size, the contours inherit those limits.
What is the difference between contour lines and a relief map?
Contour lines carry the exact elevation and are meant for measuring and design. A relief map, with hillshade or colour ramps, gives a visual impression of the terrain but does not allow elevations to be read accurately. They are often delivered together.
What does fita need to quote for a contour plan?
The perimeter of the area (KML, SHP or plan), the interval or intended use, the plan scale, the reference system and the delivery format. With that, we define whether the flight is LiDAR, photogrammetric or combined.
Contour lines are delivered labelled and ready for design work. The contour lines page details deliverables and formats, and the drone surveying service explains how the source data are captured and their accuracy controlled. The model they come from is described on the digital terrain model (DTM) page.
Written by the fita team, drone mapping and surveying in Xàtiva (Valencia, Spain).