Mapping ·
Drones in agriculture: vigour maps and NDVI explained
Drones in agriculture: what an NDVI vigour map shows, what it cannot tell you and how to order a multispectral flight that helps with irrigation decisions.
You walk the farm and some of the rows look worse than the rest. You cannot tell whether it is irrigation, soil, a pest or simply orientation. By the time the problem shows up at tree level, weeks have gone. Drones in agriculture, fitted with a multispectral camera, help at exactly that moment: they show the whole farm, let you compare zones and tell you where to look first.
This article explains what a vigour map (or NDVI map) is, what it helps you decide, what it cannot tell you and how to order a flight that is actually useful.
The problem: seeing the whole farm before the damage is visible
A medium-sized holding cannot be inspected plant by plant. You drive the tracks, look at the areas that already worry you and rely on the experience of the farm manager. It is a valid method, but it arrives late and leaves blind spots.
Typical cases in which someone orders a flight:
- A citrus or fruit plot where some rows grow worse for no clear reason.
- A new plantation where trees must be counted and gaps located before replanting.
- A drip irrigation system that delivers well in some areas and poorly in others.
- A cooperative or agri-food company that wants to compare member plots with a single criterion.
In all of them, what is missing is not opinion but a uniform image of the whole area, taken on the same day and comparable with the next one.
What is at stake
- Time. Finding an irrigation fault in a week or in a month changes the season.
- Money. Fertilising or irrigating the whole farm equally when only part of it needs it is a cost that is not recovered.
- Decisions without data. Without a common reference, two people look at the same plot and disagree.
What a vigour map is and what it really measures
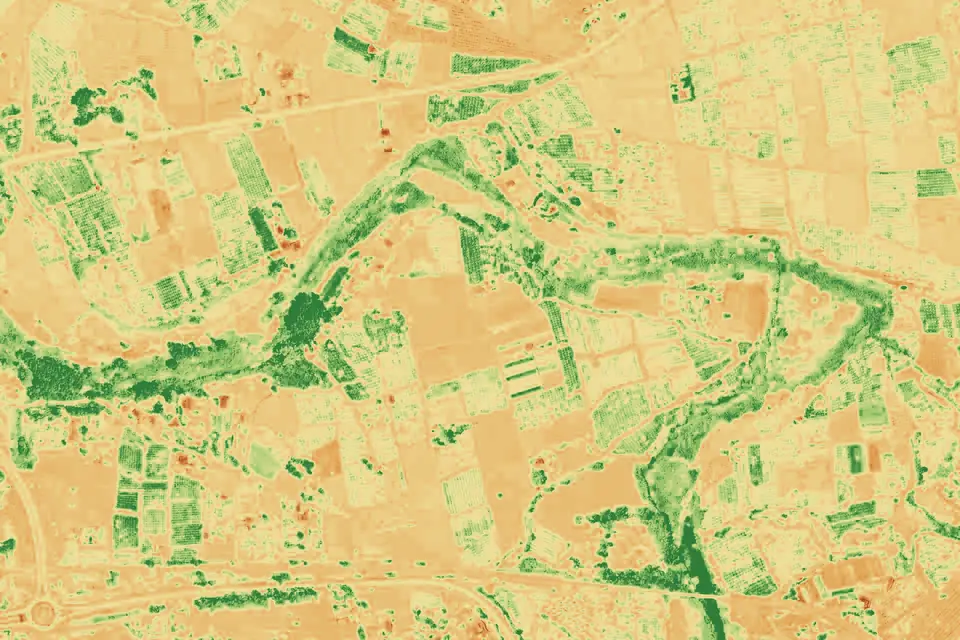
A normal camera records red, green and blue. A multispectral camera adds bands the eye cannot see, such as the red edge and near-infrared, which respond to the condition of the leaf. NDVI (normalised difference vegetation index) combines red and near-infrared into a single value per pixel. It is drawn on a colour ramp and the result is a vigour map: areas with more vegetative activity appear in one colour and weaker areas in another.
One idea needs to be clear from the start. NDVI shows relative differences in vigour within one farm and on one date. It does not say why an area is different. It can be lack of water, too much water, a pest, poorer soil, recent pruning or a crop at a different stage. The agronomic interpretation is made by the farm’s technician, who knows the land. The map tells them where to look.
NDVI also saturates when vegetation is very dense, and with bare soil between rows the value of each pixel mixes plant and soil. That is why young plantations or open alleys are surveyed at a resolution that separates canopy from soil.
Planning: what to decide before ordering the flight
Three decisions change the result far more than the drone does.
- What you want it for. Detecting problem areas, counting plants, zoning for fertiliser or comparing dates are different deliverables, with different flight plans.
- When. A vigour map makes sense at the crop stage at which the difference matters. A single flight gives a snapshot of the day. Several flights during the season give an evolution and allow comparison.
- What to compare with. For values from different dates to be comparable, the system must be calibrated and georeferenced in the same way on every flight.
If the goal is simply to see the farm in detail, an RGB orthophoto is sometimes enough. If the goal is to understand the condition of the vegetation, the multispectral camera is needed. Both flights can be made at the same time.
Execution: how a multispectral flight is carried out
This is how the work goes, in order:
- Briefing. The plot, crop, stage and deliverable are defined. We agree what is to be compared.
- Flight plan. It is planned for stable light and with enough overlap. The area covered per day depends on the terrain, the sensor, the resolution requested, the airspace and the planning; we set it in the flight plan of each project.
- Capture. We fly with a multispectral camera and a metric RGB camera aboard a DJI Matrice 400, with GNSS RTK positioning so that each plant has the same position on every flight.
- Reflectance calibration. The effect of light is corrected so that indices from two dates are comparable.
- Processing. The multispectral orthophoto is generated, the indices are calculated and the map is produced by plot or by management zone.
- Delivery. Maps in GeoTIFF and SHP, which open in QGIS and in the farm’s own software, plus the RGB orthophoto.
The resolution of the multispectral orthophoto is in the order of 5 to 10 cm per pixel, depending on flight height. That is image resolution, not accuracy. The positional accuracy of each project is agreed in the proposal.
Which indices are calculated
NDVI is the best known, but not the only one. Depending on the crop, others can be calculated, such as NDRE, which uses the red edge and discriminates better in dense vegetation. The choice depends on what has to be decided, not on having more maps.
Illustrative example: a citrus plantation with uneven rows
Picture a citrus plot in the Valencia region (Comunitat Valenciana), with localised irrigation. The manager notices that one sector has paler leaves, but does not know whether the problem is the irrigation line, the soil or something on the tree. Walking the whole plot would take a day and still would not give an objective comparison.
A multispectral flight is made. The vigour map shows that the weak zone matches two specific irrigation lines and not a type of soil. With that clue, the technician checks the emitters on those lines and confirms the fault. Without the map the whole plot would have been checked, and it would have taken longer.
This case is illustrative, not a real job. It shows the order of things: the map points to where to look and the person who knows the crop decides what is happening.
What you receive
- Vigour map (NDVI) and other indices of the whole plot, on the same scale to compare zones.
- RGB orthophoto and multispectral orthophoto, georeferenced and able to be overlaid on SIGPAC (Spain’s agricultural parcel system).
- Management zones: the plot divided according to vigour, useful for differentiated fertilising or irrigation.
- Tree or plant counts, useful in new plantations to see gaps.
- DTM of the farm, if needed for irrigation and drainage.
- Comparison between dates, if there are several flights in the season.
Maps are delivered in formats that any GIS software opens. The agronomic interpretation is made by the farm’s technician.
What a vigour map does not do
- It does not diagnose a pest or a disease: it indicates that something is happening in that area.
- It does not replace soil analysis, moisture measurement or a visit to the field.
- It is not comparable between different crops or different stages without judgement.
- It is not a fertiliser recipe: it helps decide where to act, not how much to apply.
Spraying or treating crops with a drone is a different activity, with its own regulation, and is not something we do. Our work is mapping and data.
Frequently asked questions
What is an NDVI map and what is it for?
It is a vegetation vigour map calculated from the red and near-infrared bands of a multispectral camera. It is used to locate areas of the farm that behave differently from the rest and to decide where to check first. It does not give the cause, only the difference.
How many flights are needed in a season?
It depends on the crop and on the decision to be made. One flight gives an image of the day. Several flights at key stages show the evolution and allow comparison. It is agreed in the proposal according to the goal.
Can I use just an orthophoto instead of multispectral?
To see the plot in detail and count plants, an RGB orthophoto may be enough. To assess the condition of the vegetation the multispectral camera is needed, because the bands that measure vigour are not in a normal photo.
Can I compare this year’s map with last year’s?
Yes, if the flights were calibrated and georeferenced consistently and the crop was at a comparable stage. That is why it is worth defining from the start what will be compared.
If you have a farm or several plots and want to know what a multispectral flight would show, tell us about the case: the precision agriculture with drones service describes how we work, and the orthophoto page explains the mapping base of each delivery. We work in the Valencia region, across Spain and in Europe.
Written by the fita team, drone mapping and surveying in Xàtiva (Valencia, Spain).