Mapping ·
Flood zone maps in Spain: checking them and the DTM's role
Flood zones in Spain: what they are, how to check the official SNCZI viewer and why the quality of the DTM decides the outcome of a flood risk study.
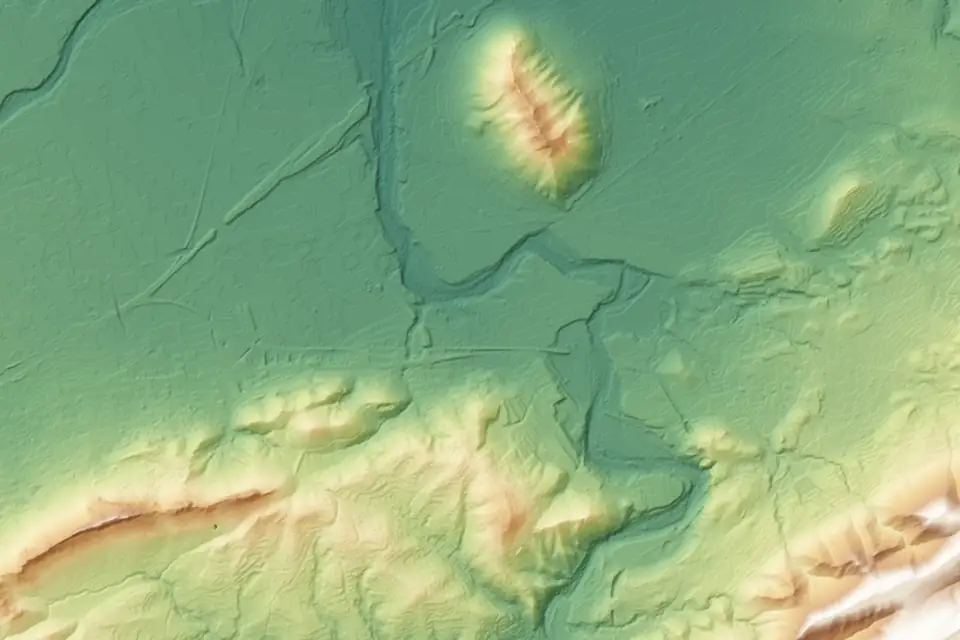
Flood zones are the areas that water can occupy when a river, a gully or a dry riverbed (rambla) overflows. Knowing whether a site lies within a flood zone affects what can be built there and how. This article explains what flood zones are, how to check the official flood zone maps in Spain and what role the digital terrain model (DTM) plays in the studies that define them.
A clarification from the start. At fita we do not carry out hydraulic studies and we do not delineate flood zones. We provide the terrain: the DTM, the contour lines and the drainage network used by whoever models the water. That is why this article focuses on the topographic data.
What are flood zones?
A flood zone is the area that water would occupy in a flood of a given probability. It is not a fixed line on the ground. It is the result of a calculation: the flow of a flood is estimated, the way water moves over the terrain is simulated and the resulting extent is mapped.
That is why flood zones are always linked to a return period. The return period is the average interval, in years, between two floods of that size. A 100-year flood does not happen once a century: it has a 1% chance of occurring in any given year.
Return periods: 10, 100 and 500 years
Official Spanish flood mapping usually works with three scenarios:
| Return period | Probability | In practice |
|---|---|---|
| 10 years | High | Areas that get wet often |
| 100 years | Medium or occasional | Reference scenario in many analyses |
| 500 years | Low or exceptional | Extraordinary floods |
Each scenario gives a different extent. The longer the return period, the greater the flow and the wider the flooded area.
Preferential flow zone and flood zone
Within the flood zone there is the preferential flow zone (zona de flujo preferente). It is the part where water flows deepest or fastest during a flood, and where the potential damage is greatest. Its delineation and what it means for land use are set by water legislation and the relevant river basin authority. For any specific question, the reference is always the river basin authority (confederación hidrográfica).
How to check flood zone maps in Spain
The official viewer is the SNCZI, Spain’s National Flood Zone Mapping System, published by the Ministry for the Ecological Transition and the Demographic Challenge (MITECO). It is the starting point for any site in Spain.
The SNCZI viewer step by step
- Open the SNCZI map viewer from the MITECO website.
- Find the area by municipality, by coordinates or by panning the map.
- Turn on the layers you need: flood zones by return period, preferential flow zone and, where available, the hazard and risk maps.
- Overlay an orthophoto or the cadastre to locate the site accurately.
- Check the information for each layer: date of the study, reach studied and responsible authority.
One important detail: the SNCZI does not cover every watercourse. It includes the reaches that have been studied, which are usually those with the highest risk. A site that falls outside every flood extent is not always free from flooding. It may simply mean that the nearby gully has not been studied.
Flood zones in Valencia and the Valencia region
In the Valencia region (Comunitat Valenciana), it is worth checking, in addition to the SNCZI, the flood risk mapping of the regional government (Generalitat), published through the viewer of the Valencian Cartographic Institute (Institut Cartogràfic Valencià). Valencia, Alicante and Castellón have many short gullies and ramblas with fast floods, so both sources are read together. If they do not match, whoever signs the study decides which one applies in each case.
What role does the DTM play in a flood risk study?
A hydraulic model works out where water goes from two inputs: the flow and the shape of the terrain. The flow comes from the hydrological study. The shape of the terrain comes from the DTM. If the DTM is poor, the model reproduces in great detail a terrain that does not exist.
The DTM enters the study in several ways:
- Geometry of the channel and banks: cross-sections in 1D models or the computational mesh in 2D models.
- Features that divert water: levees, walls, terraces, road and track embankments, ditches.
- Drainage network and catchments: delineation of the area draining to each point, which feeds the flow calculation.
- Site elevation: comparison between the calculated water surface and the ground, which gives the water depth at each point.
Which resolution and accuracy matter
Resolution is the cell size of the DTM. A grid of several metres smooths the terrain: a 60 cm wall or a ditch disappears inside the cell. A drone DTM, with cells of 10 to 20 cm, keeps those features. The modeller then decides the size of the computational mesh, but starts from a terrain that does include them.
Accuracy is something else. The typical vertical accuracy of a drone DTM is 2 to 5 cm, expressed as root mean square error (RMSE) on open ground, in the project reference system (ETRS89 / UTM, with orthometric heights). It is checked against independent checkpoints that are not used in the adjustment. The accuracy of each job is agreed in the proposal and documented in the control report.
On a floodplain, where a few centimetres of height difference decide where the water spreads, vertical accuracy matters as much as resolution.
Public DTM or project DTM
The CNIG, linked to the National Geographic Institute of Spain (IGN), publishes the MDT05 for the whole of Spain and, depending on coverage, finer products such as the MDT02 and the PNOA-LiDAR point clouds (PNOA is Spain’s National Aerial Orthophoto Programme). They are a good starting point for a preliminary study or for delineating large catchments. Before using them, it is worth comparing their date, resolution and accuracy with what the study requires.
A project survey makes sense when the terrain has changed since the last public flight, when the study needs small features (levees, walls, ditches) or when the required vertical accuracy is higher. They are often combined: the public model for the catchment and the drone DTM for the reach and the site.
How a DTM suitable for flood modelling is produced
A DTM for a flood risk study is no different in method from other DTMs, but certain things get more care.
- LiDAR or photogrammetric flight, depending on the vegetation. In channels with reeds or riparian woodland, LiDAR is the right choice: the multiple returns help to record the terrain through gaps in the vegetation. We classify the ground points and check the coverage obtained.
- GNSS RTK support and ground control points measured in the field.
- Ground classification reviewed by hand on banks, slopes and levees, which are the areas where automatic algorithms fail most.
- Breaklines along levee crests, channel edges and toes of slopes, so that the mesh does not smooth them out.
- Field measurement of what the flight cannot see: the inside of culverts and bridges, and the channel bed under water, which topographic LiDAR does not penetrate.
- Quality control with independent checkpoints and a control report.
What topographic data is used for in flood zones
- Flood risk studies required to process a project, prepared by the engineering firm or consultancy that signs them.
- Layout of solar plants and industrial parks: knowing which part of the site to avoid and where to route the drainage.
- Design of cross-drainage structures on roads and tracks.
- Checking the current condition of levees and channelised reaches.
- Urban planning, when a development area borders a gully.
Frequently asked questions
How can I find out whether a site is in a flood zone?
The most direct way is to find it in the SNCZI viewer and turn on the flood zone and preferential flow layers. In the Valencia region it is also worth checking the regional government’s risk mapping. If the nearby watercourse has not been studied, only a flood risk study can give the answer.
What is the difference between a flood zone and a preferential flow zone?
The flood zone is the whole area occupied by water in a flood of a given return period. The preferential flow zone is the part of that area where water flows deepest or fastest. Its extent and its effects are set by water legislation and the river basin authority.
Does fita carry out flood risk studies?
No. We do not calculate flows or water depths, and we do not delineate flood zones. We survey the DTM, the contour lines and the drainage network with the resolution and accuracy required by the engineering firm doing the study, and deliver the data in the format of its software.
Is the IGN DTM enough for a flood risk study?
It depends on the study. For large catchments and preliminary analyses it is usually enough. For the channel reach and the site, where walls, levees and a few centimetres of height difference matter, it is worth comparing its date and accuracy with what is needed and considering a project survey.
The drone LiDAR survey service explains how we record the terrain beneath riparian vegetation, and the digital terrain model (DTM) and drainage network and catchments pages detail deliverables, formats and accuracies.
Written by the fita team, drone mapping and surveying in Xàtiva (Valencia, Spain).