Mapping ·
Shadow map: how it is calculated with a drone DSM
Shadow map of a site calculated on a drone DSM: which shadows it shows, what it delivers and what data to ask for before designing a plant or development.
You are about to design on a site and the developer asks which areas will be in shadow, and when. On the site visit it looked clear, but there is a rise to the south, a row of pine trees beside the track and a building to the west. Without a shadow map, those three things are discovered when the installation is already producing less than planned.
This article explains what a shadow map is, how it is calculated with a digital surface model (DSM) captured by drone and what to ask for so that it is useful in design.
In short: a shadow map shows, for every point of a site, how many hours of direct sun it receives and when it falls into shadow. It is calculated on a DSM, the model that includes ground, vegetation and buildings, captured by drone. Engineering firms and developers use it to place panels, space rows or choose between sites.
The problem: the shadow you do not see on the visit
A shadow map answers the question of how much direct light each part of a site receives. The difficulty is that shadows change with the hour and the season, and a field visit only shows the shadow of that day.
These are the situations in which one is usually requested:
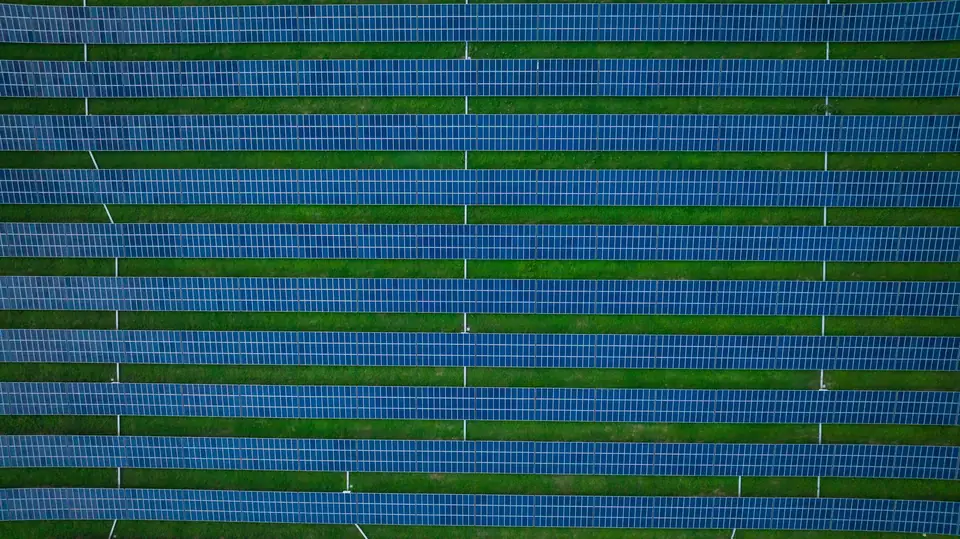
- A solar (PV) plant on a large site with rises, hollows and trees along the edges.
- An industrial park or a development where neighbouring buildings or the relief take light from an area.
- A roof or a platform where you have to decide where to place the panels.
- A preliminary study to rule out sites before investing in a design.
In every one of them, what is missing is measured data on what stands on the ground, not an estimate by eye.
What is at stake
A badly made shadow map costs money in three ways:
- Output. A partial shadow over one row of panels reduces the output of the whole string it belongs to. If it is discovered after construction, a drawing no longer fixes it.
- Design. The spacing between rows and the orientation depend on the shadows the rows cast on each other and on those coming from outside.
- Purchase decision. Among several sites, the shadow map helps to rule out the one that loses most light before paying for the full design.
What a shadow map is and why it is calculated on a DSM
The shadow map is a georeferenced image that colours each cell of the site by its hours of direct sun on a given date or season. It is calculated on a DSM, the digital surface model: the height of everything that is there, including trees, buildings, walls and stockpiles.
You have to start from the DSM and not from the DTM. The DTM is the bare ground and does not include the row of pines or the building, which are exactly what casts the shadow. With a DTM you would only see the shadow of the relief.
A coarse official model does not tell a row of trees from an open field either. A drone DSM has cells of centimetres and records what exists on the date of the flight.
Execution: how it is calculated
The work follows this order:
- Define the area and the use. Site boundary, the season of interest and whether a row layout is already planned.
- Drone capture. A photogrammetry or LiDAR flight depending on the vegetation, supported by GNSS RTK and ground control points measured in the field.
- Point cloud and DSM. The surface is generated in official ETRS89 coordinates, with trees, buildings and walls included.
- Accuracy control. It is checked against independent checkpoints. A typical value is 2 to 5 cm (RMSE, over open ground and with independent checkpoints). Over vegetation, the canopy height is the one at the time of the flight.
- Horizon calculation. For each cell, the angle the sun must clear from each direction to light it is obtained. The relief and the obstacles come in here.
- Map of sun and shade hours. With the sun path for the latitude of the site, representative days are calculated: the solstices, the equinoxes or month by month.
- Shading between rows. If the client provides the design, the shadow the rows cast on each other is also calculated, with the planned height and spacing of the structures.
What changes with vegetation
With LiDAR, multiple returns help to record the ground through gaps in the vegetation. We classify the ground points and check the coverage obtained. For a shadow map the canopy height also matters, and it also comes from the point cloud.
With photogrammetry, the DSM records the visible surface well, canopies included, but the ground under dense tree cover is interpolated. For shadows from tall obstacles that is enough. For the ground under the trees, LiDAR is better.
Illustrative example: a site with a rise and trees
This example is illustrative and does not correspond to a real fita project.
An engineering firm studies a site in the Valencia region (Comunitat Valenciana) for a solar plant. To the north there is a gentle rise. To the west, a line of pines beside a track. To the east, an agricultural building.
The DSM is captured by drone and sun-hour maps are calculated for the seasons with the lowest sun, which are the critical ones. The map shows that the strip beside the pines loses sun late in the afternoon. It also shows that the shadow of the building affects only one edge. The rise, by contrast, casts hardly any useful shadow over the interior.
The firm moves the rows on the western edge back, leaves the strip beside the building for access roads and designs the rest without restrictions. The decision comes from a map and not from an argument on the site visit.
What you receive
- Sun-hour maps by day and season, in GeoTIFF.
- Areas with significant shading outlined as vectors (SHP or GeoPackage).
- Values by sector in CSV or XLSX, if the design is divided into sectors.
- A PDF report with the method, the maps and the conclusions.
- The DSM and a base orthophoto, so that the team can repeat the calculations in its own software.
The accuracy of each project is agreed in the proposal and documented in the control report.
What a shadow map does not do
- It is not an output estimate. It gives sun hours and shaded areas. The plant output is calculated by the engineering firm with its own model.
- It does not foresee what changes after the flight. A growing tree or a new building does not appear. If the surroundings change, the capture is repeated.
- It does not replace the design. It is measured data on which the technical team decides.
- It does not improve with a prettier image. Its quality depends on the accuracy of the DSM and on the obstacles being properly recorded.
Frequently asked questions
What is the difference between a shadow map and a shading analysis?
The map is the visual result: sun hours per cell. The analysis also includes the method, the dates calculated, the outlined areas and the conclusions for the design.
Is a DTM enough to calculate shadows?
It only records those of the relief. To see those of trees, buildings and walls you need a DSM.
Can the shadow between rows of panels be calculated?
Yes, if the design is known: height, tilt and spacing of the structures. It is the calculation that sets the minimum spacing between rows at low sun hours.
What does fita need to get started?
The site boundary (KML, SHP or a drawing), the intended use, the season of interest and, if it exists, the row layout. With that, the capture is defined and the accuracy is agreed.
If you have to decide what goes where before designing, tell us about the case at fita, based in Xàtiva. The page on shading analysis describes the product, and the drone surveying service explains how it is captured and how its accuracy is controlled.
Published by fita, drone mapping and surveying based in Xàtiva (Valencia, Spain).