Mapping ·
Relief map: how it is generated from a DTM
Relief map from a drone DTM: hillshade, colour ramps and contour lines, when to use each and how to specify one so that the terrain is easy to read.
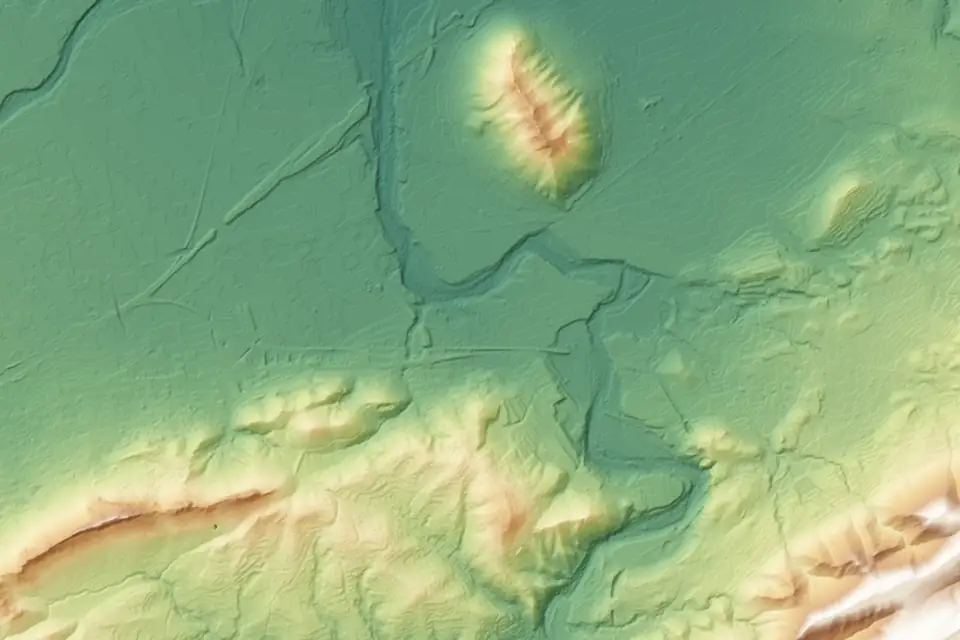
You have to present a project to a landowner, a town council or a management committee. The contour plan is correct, but nobody in the room can read it. They ask where the steep ground is and you have to point at it. A relief map solves that moment: the terrain is understood at a glance, without needing to read elevations.
This article explains what a relief map is, how it is generated from a digital terrain model (DTM), how it differs from contour lines and how to specify one so that it is useful.
The problem: a plan that only technicians can read
Contour lines are the measuring tool of the project. They carry the exact elevation and are used for design. But they take practice to read, and not everyone who decides on a project has it.
These are the situations in which a relief map is usually needed:
- A meeting with landowners who have to be told why an area cannot be built on or why a track changes its route.
- An options report for a site layout, in which the slopes and the flat areas have to be shown.
- A report for an authority that asks for an understandable plan of the existing ground.
- A review of a site before a field visit, to know where to go first.
In every one of them, what is missing is not more precision but a way of seeing it.
What is at stake
If the plan is not understood, decisions are made on the intuition of whoever speaks best, not on the data. A slope that is misjudged can end in a trench that was not planned, a plot discarded for no reason or a discussion that drags on for weeks.
There is also a less obvious risk: using an attractive map as if it were a measuring plan. Shaded relief is not for reading elevations with precision. It is for understanding the shape of the ground. Each product has its own function.
What a relief map is and where it comes from
A relief map is an image that shows the shape of the terrain with light and colour. It is not measured by hand or drawn: it is calculated from a DTM, the digital terrain model, which is the surface of the bare ground without buildings, trees or objects.
Three techniques are used, almost always combined:
- Hillshade. A light source is simulated shining on the terrain from a set direction and height. Slopes facing the light are brightened and the opposite ones darkened. The result looks like an illuminated scale model.
- Colour ramp (hypsometric tints). Each height receives a colour: for example, greens for low ground and browns for high ground. What is high and what is low is understood at once.
- Slope map. Each cell is coloured according to how steep it is. This is the map that answers the question “where can we build” or “where does earth have to be moved”.
The usual delivery is the hillshade as a base, with the colour ramp or the slopes on top and some transparency. That way the shape and the height are read together.
Planning: what to decide before ordering one
Four things are worth settling before the flight, because they determine what is captured and how it is processed.
- What it will be used for. A map for a meeting needs visual impact. One for a technical report needs a legend, a scale and a coordinate grid.
- What level of detail is needed. The relief of a large estate does not need the same detail as that of a platform that is going to be levelled.
- Whether there is vegetation. Under dense tree cover the ground cannot be seen from above, and a model built from photographs alone may interpolate the ground without real data. With LiDAR, multiple returns help to record the terrain through gaps in the vegetation. We classify the ground points and check the coverage obtained.
- What format it is delivered in. An image for a presentation, GeoTIFF for GIS or a PDF at scale for printing.
Execution: how a relief map is generated
The drone workflow has these steps:
- Capture. A flight with LiDAR, with a metric RGB camera or with both, supported by GNSS RTK and ground control points measured in the field.
- Georeferenced point cloud in official ETRS89 coordinates.
- Ground classification. Ground points are separated from vegetation and structures. Difficult areas, such as embankments and channel margins, are reviewed by hand.
- DTM. A surface is interpolated from the ground points only and checked against independent checkpoints. A typical value is an error of 2-5 cm (RMSE, over open terrain, checked on independent checkpoints).
- Relief calculation. The hillshade, the colour ramp and, if requested, the slopes are generated from the DTM.
- Visual adjustment. The light direction and the palette are chosen, and a decision is made on whether to exaggerate the relief vertically on very flat ground.
- Layout and delivery. A legend, scale, north arrow and grid are added if the map is for a document, or the clean image is delivered.
The direction of the light matters
Hillshade simulates a light, and the light changes what is seen. With light from the north-west, the most widespread convention in mapping, the relief reads naturally. With light from another direction, valleys can look like ridges. That is why a good relief map uses a constant direction and states it in the legend.
Another detail: features aligned with the light are hardly shaded at all. If a gully runs parallel to the light direction, it disappears. The fix is to combine several directions or to rotate the light to suit the terrain.
When to exaggerate the relief
On almost flat ground, such as a platform or a field, differences in elevation are barely visible. Vertical exaggeration makes small undulations visible. It is a visual decision and it is declared as such: the map says so, and it is never mixed up with a measuring plan.
Relief map and contour lines: they do not compete
This is the most frequent doubt. The short answer is that they are delivered together.
| Relief map | Contour lines | |
|---|---|---|
| What it is for | Understanding the shape of the ground | Measuring and designing |
| Who reads it | Anyone | Technicians |
| Reading elevations | Approximate | Exact |
| Where it is used | Meetings, reports, visits | Design plans, CAD |
Contour lines carry the exact elevation and are the working plan. The relief map is the layer that makes it understandable. When the index contours are overlaid on the hillshade, the same document serves both the person who designs and the person who decides.
Illustrative example: a hillside plot for a site layout
This example is illustrative and does not correspond to a real fita project.
A developer is studying three plots in the Valencia region (Comunitat Valenciana) for a layout that needs areas of low slope. It has old plans of each plot, with contours at different intervals and from different dates. They are not comparable and nobody on the committee reads them with ease.
A DTM of the three is surveyed on the same day with the same criteria. For each one, a relief map is delivered with the same palette, the same light and the same scale, with the slope map on top. On a single page it can be seen that the first plot has a steep slope over two thirds of its area, that the second is almost flat but crossed by a gully and that the third combines a usable flat area with an embankment at the edge. The committee does not argue about the plan: it argues about the decision.
What you receive
- Relief map with hillshade, colour ramp and, if requested, slopes.
- DTM in GeoTIFF, in case the team wants to regenerate the relief with other parameters.
- Contour lines at the agreed interval, in DWG, SHP or GeoPackage.
- Image or PDF at the agreed scale, with legend and reference system.
- Quality control report with the check against independent points.
The accuracy of each project is agreed in the proposal and documented in the quality control report.
What a relief map does not do
- It does not replace the measuring plan. For design, setting out or volume calculations, the work is done on the DTM and the contours, not on the image.
- It does not show more detail than the model has. If the DTM has a coarse cell size, the relief will come out smoothed however good the hillshade looks.
- It does not say what is ground and what is not. If the ground classification is poor, the relief shows buildings or tree crowns as if they were hills.
Frequently asked questions
What is the difference between a relief map and a DTM?
The DTM is the data: a grid of ground heights. The relief map is a way of drawing it with light and colour so that it can be understood. Several different maps can be made from the same DTM.
Can I make a relief map from a public DTM?
Yes, with any GIS program. The CNIG (the mapping centre of Spain’s National Geographic Institute, IGN) publishes the MDT05 for the whole of Spain. It is useful for a preliminary study, but its date, resolution and detail have to be compared with what the project requires. If the terrain has changed or more detail is needed, a dedicated survey provides what is missing.
Can a relief map be used to measure slopes?
Hillshade cannot. A slope map can, because it is calculated from the numerical value of each DTM cell. For any decision with design consequences, use the numerical reading and not only the visual one.
What does fita need to prepare a relief map?
The boundary of the area (KML, SHP or plan), the intended use, the scale or print size, the reference system and the delivery format. With that, the flight is defined and the accuracy is agreed.
If you need the terrain to be understood in a meeting and measurable in the project, tell us about your case. The page on the digital terrain model (DTM) describes the starting product, and the drone surveying service explains how the data is captured and its accuracy controlled.
Written by the fita team, drone mapping and surveying in Xàtiva (Valencia, Spain).