LiDAR ·
Point cloud: what it is and how it is classified
What a point cloud is, how LiDAR or photogrammetry captures it and how it is classified into ground, vegetation and buildings to build a reliable DTM.
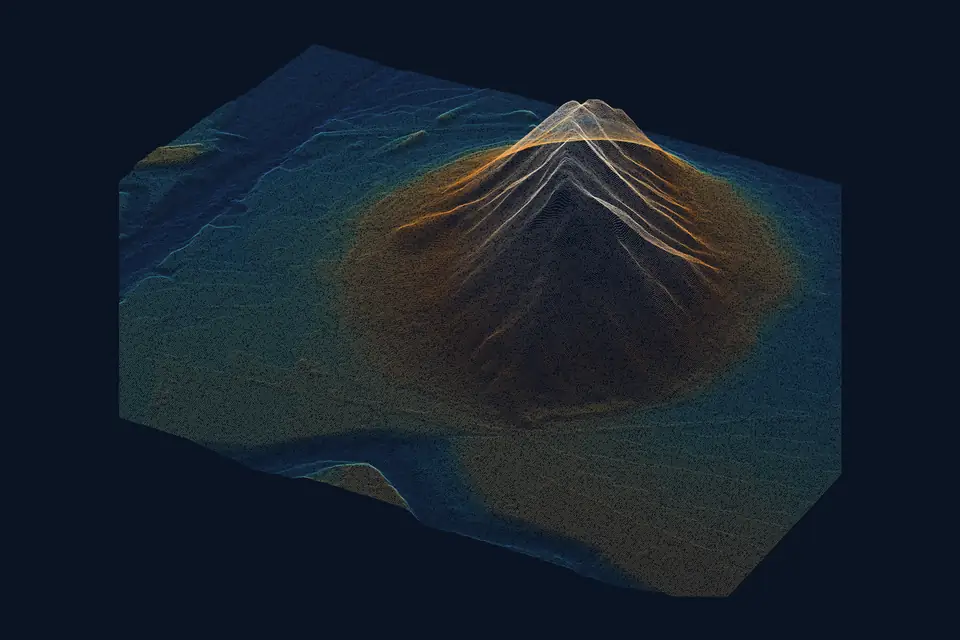
A point cloud is a set of millions of points with X, Y, Z coordinates that describes the shape of a terrain, a worksite or a building. It is the raw product of a LiDAR or photogrammetry survey, and the basis of almost all the mapping that follows. This article explains what a point cloud is, how it is captured and how it is classified so that it is genuinely useful in a project.
What is a point cloud
Each point in the cloud is a measurement. It carries its coordinates in the project reference system and, depending on the technique, extra attributes: colour, return intensity, return number or class.
A point cloud is not a drawing or a model. It is a collection of samples with no connection between them. To get a continuous surface you have to interpolate between those points, and for the result to be reliable you need to know what each point is: ground, tree, roof or cable.
LiDAR point cloud and photogrammetric point cloud
Both techniques produce point clouds, but by different routes.
- LiDAR: the sensor emits laser pulses and measures the round-trip time. Each pulse can produce several returns. The position of each point comes from combining those distances with the drone trajectory (GNSS RTK and IMU).
- Photogrammetry: the software matches the same details across many overlapping photographs and calculates their position by triangulation. It only sees what the camera sees, so it records the visible surface. Besides colour, it provides the basis for the orthophoto.
A LiDAR cloud does not depend on sunlight and records fine elements such as cables. A photogrammetric cloud gives true colour and good texture on open surfaces. Many projects combine both sensors. Our guide to LiDAR explains in more detail when each technique fits.
How a point cloud is captured with a drone
The process has four stages, whatever the sensor.
- Flight plan: altitude, overlap and speed according to the density and resolution the project requires.
- Field control: ground control points and checkpoints measured with GNSS RTK or a total station.
- Capture: a flight with the LiDAR sensor or the metric RGB camera.
- Processing: georeferencing, adjustment between passes or blocks, and a check against the checkpoints.
Cloud density is measured in points per square metre. It depends on the sensor, the flight altitude and speed, and the overlap between passes. Higher density gives more detail of walls, ditches and slopes, but also heavier files. The sensible approach is to ask for the density the final deliverable needs, not the highest possible.
What it means to classify a point cloud
Classifying a point cloud means assigning a category to each point. Without that information every point is the same, and the terrain cannot be separated from what stands on it.
The LAS and LAZ formats define a standard set of numeric classes that almost every program uses. The most common ones are these.
| Class | Code | What it is used for |
|---|---|---|
| Ground | 2 | Basis of the DTM |
| Low, medium and high vegetation | 3, 4 and 5 | Separating trees and scrub |
| Building | 6 | Surface models and volumes |
| Water | 9 | Delineating channels and water bodies |
| Noise | 7 and 18 | Discarding erroneous points |
Project-specific classes can also be defined, such as conductors, towers or stockpiles.
How classification is done
Classification combines automation and review.
- Noise filtering: isolated points above or below the real surface, caused by reflections or birds, are removed.
- Ground classification: an algorithm looks for the lowest surface compatible with neighbouring points and marks the points that fit as ground. Parameters such as structure size and maximum slope are tuned.
- Classification of the rest: height above ground and shape are used to separate vegetation, buildings and linear elements.
- Manual review: in difficult areas (slopes, low walls, dense vegetation, structures) what the algorithm cannot resolve is corrected by hand.
Why ground classification matters
A DTM is only as good as the ground classification it starts from. A scrub point classified as ground shows up as a mound that does not exist. A ground point classified as vegetation opens a gap that the model fills by interpolation.
With LiDAR, multiple returns help record the terrain through gaps in the vegetation. We classify the ground points and check the coverage obtained. Under very dense vegetation that coverage can be sparse, and it is worth knowing that before relying on the model in that area.
What a classified point cloud is used for
A well-classified cloud yields the products that engineering firms, contractors and operators use.
- Digital terrain model (DTM): calculated only from ground points.
- Digital surface model (DSM): includes vegetation and buildings.
- Contour lines and profiles: derived from the DTM at the contour interval the project requires.
- Volume calculations: the volume is calculated by integrating the difference between two compatible surfaces within a defined boundary.
- Power lines: distances between conductors and vegetation, cable sag and tower heights.
- 3D models: coloured clouds or meshes for viewers and project review.
Point cloud accuracy: what to ask for
The accuracy of a cloud depends on the sensor, the trajectory, the field control and the terrain. A typical value for a well-adjusted drone cloud is 2-5 cm, expressed as root mean square error (RMSE), on open terrain or well-defined surfaces, in the project reference system (ETRS89 / UTM) and checked against independent checkpoints. The accuracy of each project is agreed in the proposal and documented in the quality control report.
It helps to keep three concepts apart.
- Density: how many points there are per square metre.
- Resolution: the size of the detail that can be distinguished. In photogrammetry, the GSD.
- Accuracy: how close each point is to its true position.
A very dense cloud can still be offset by several centimetres. That is why the control report is part of the deliverable.
Delivery formats
Formats are chosen to suit the client’s software.
- LAS and LAZ: the most widespread for classified clouds. LAZ is the compressed version.
- E57: useful for exchange between programs from different vendors.
- Web viewers and 3D Tiles: to browse the cloud without installing anything, for example from a GIS platform.
- Derived products: GeoTIFF for models, DWG, DXF or SHP for contours and profiles.
The usual system is official ETRS89 coordinates (UTM, in the appropriate zone), with orthometric heights unless the project asks for another reference.
Frequently asked questions
What is the difference between a point cloud and a 3D model?
The cloud is the set of measured points, with no connection between them. The 3D model joins those points into a mesh of surfaces and often adds texture. The model is generated from the cloud.
How many points does a point cloud have?
It depends on the area, the sensor and the density requested. It can range from millions of points on a small plot to hundreds of millions over a large area. The right density is the one the final deliverable needs.
Can a photogrammetric cloud be classified?
Yes, with one limitation: photogrammetry records the visible surface. Under dense vegetation there are no ground points, so what the camera did not see cannot be classified. For terrain under tree cover, LiDAR is usually the more suitable option.
Which programs open a point cloud?
LAS, LAZ and E57 files open in common GIS, CAD and BIM programs, and in free viewers for consultation. Very large files may need a machine with enough memory or a web viewer.
If your project needs a classified point cloud and a reliable terrain model, our drone LiDAR survey and drone photogrammetry services and the point cloud page set out the deliverables, formats and how we work. We work from the Valencia region on projects across Spain and Europe.
Written by the fita team, drone mapping and surveying in Xàtiva (Valencia, Spain).